SYS/09 · DATA ANALYTICS
Employee Attrition Analysis
Power BI HR attrition analysis using key-influencer visuals to surface job satisfaction, work-life balance, and overtime as the primary drivers of attrition.
- TOOL
- Power BI
- MODEL
- DAX
- PAGES
- 4
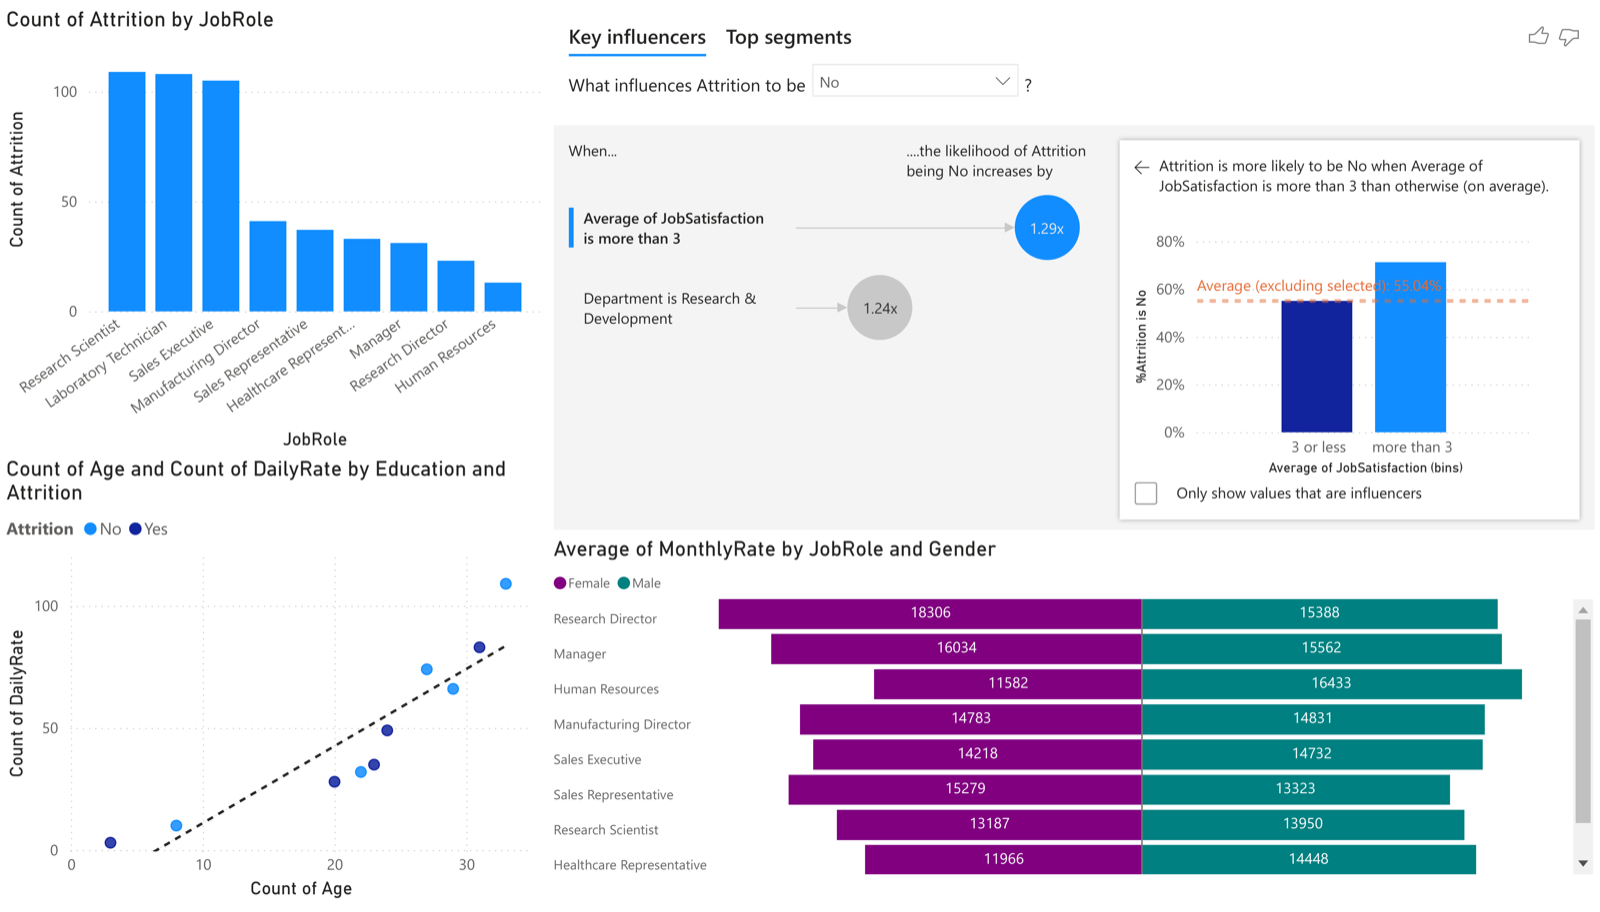
An HR attrition analysis built in Power BI using key-influencer visuals. The model surfaced job satisfaction, work-life balance, and overtime as the primary drivers of attrition.
KEY FACTS
- Built in Power BI using the key-influencers visual.
- Average job satisfaction above 3 raises the likelihood of no attrition by 1.29x.
- Work-life balance index raises the likelihood of no attrition by 2.85x.
- No overtime raises the likelihood of no attrition by 1.76x.
Key influencers
Power BI's key-influencers visual ranks what increases the likelihood of an outcome. For attrition staying "No," average job satisfaction above 3 is a 1.29x influencer, a higher work-life balance index is a 2.85x influencer, and having no overtime is a 1.76x influencer.
Other views
The report also breaks down attrition count by job role, and average monthly rate by job role and gender, across four pages in total.